A Fanno Flow line on a T-s diagram is developed using the continuity and energy equations. A Rayleigh Flow line on a T-s diagram on the other hand is developed using the continuity and momentum equations. A solution to both a Fanno Flow and Rayleigh Flow is the same as solving continuity, momentum and energy, which are used in solving Normal Shocks.
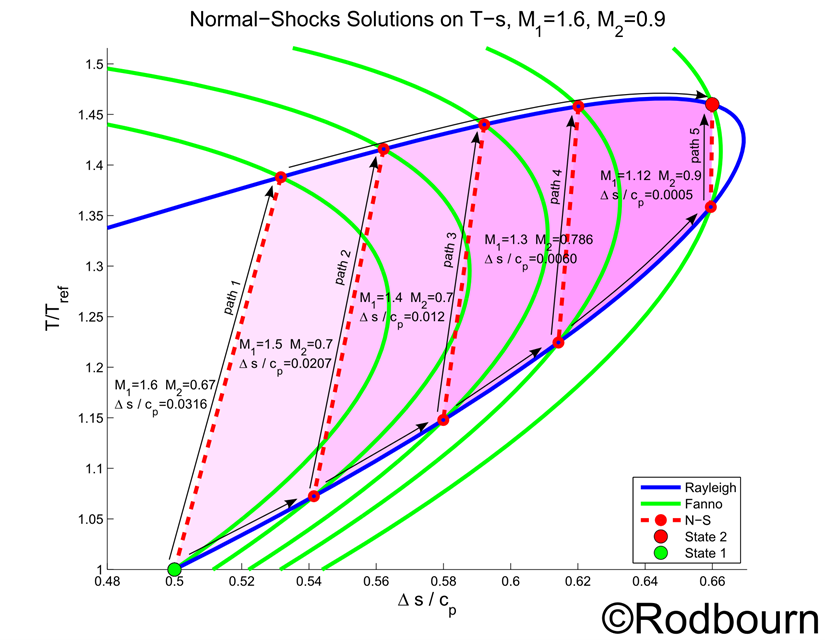
A Normal Shock can then be seen as the intersection of both a Fanno line and Rayleigh line on a T-s diagram. In moving from state 1 to a second state 2 on a Rayleigh line there are several possible paths as shown below. While both ending states have the same Mach number, each path requires different amounts of energy (heat transfer into the flow), seen as the area under the curve on a T-s diagram. In the examples of the figure, path 5 requires the least heat and path 1 requires the most heat addition.
In creating the T-s Diagram below, all of the flows share the same reference temperature, the temperature at state 1. The entropy changes were shifted so that all the curves have zero entropy generation at state 1. The Diagram below is my own original work.